
Insights: Report Admin
Welcome to Report Admin in Outbound by Enreach.
Here you can view a selection of default reports or customise your own in order to check the performance of Projects, Campaigns, Teams, and Agents through a large variety of KPIs.
Please note that Report Admin is one of Outbound by Enreach's legacy features, and will be removed in the future.
Head over to Reports for the same functionality of Report, but greatly improved, with more features, extra power, and an easier user experience!
Read through the article, or click a link below to get started.
In this article:
Default Reports
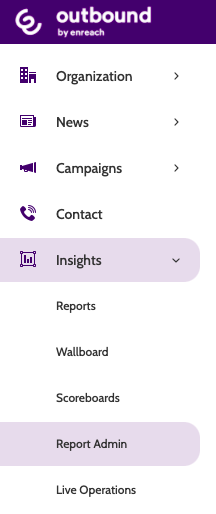
To access Report Admin, expand the Insights drop-down menu and select Report Admin.
In the navigation page you will be able to select a report from Default reports, or create your own.
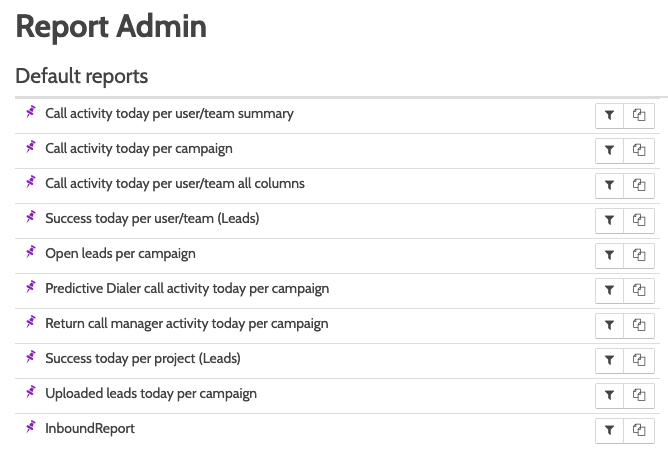
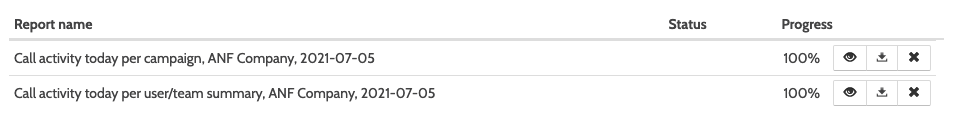
Click a Default report and it will move to a report list below.
Click the eye icon to view the report in a separate browser window.
Click the arrow icon to download the report data as an XLSX file to your desktop, or click the cross icon to remove the report from the list.
Clone and Edit Default Report
To clone and edit a Default report, click the clone icon to the right.

The report will automatically be cloned.
Enter a name for the cloned report in the text box.
Once you have configured the report details, click the arrow icon to download the report data as an XLSX file to your desktop, or Preview to see how the report will look.
To edit the report, click on one of the following headings to expand the settings:
- Projects, Campaigns, and Lead Pools
- Organization Units
- Date and Time
- Lead Status and Results
- Rows
- Columns
- Share Report With

Projects, Campaigns, and Lead Pools
The default view for Projects, Campaigns, and Lead Pools is to display all.
To manually choose what to show in the report, check the box next to your selection, or expand the All drop-down menu.
Filter the view by using the Search bar, or expanding the All drop-down menu to choose a Project.
Click the eye icon to filter the list between Active and Inactive Projects and Campaigns, or choose to display everything.
Please note that Campaigns and Lead Pools need to be active in order to be selected.

Organization Units
Under Organization Units, configure what areas of your Organization should be shown in the report.
Click the part of the Organization you want to show. Any Team or unit below the one selected will also be shown in the report.
Click the Show average checkbox to display the average KPI metrics for each row.
Toggling between All, Subordinate Units, and None in the first set will configure which part of the Organization you want to show data from in the report, and Users in the second set.

Date and Time
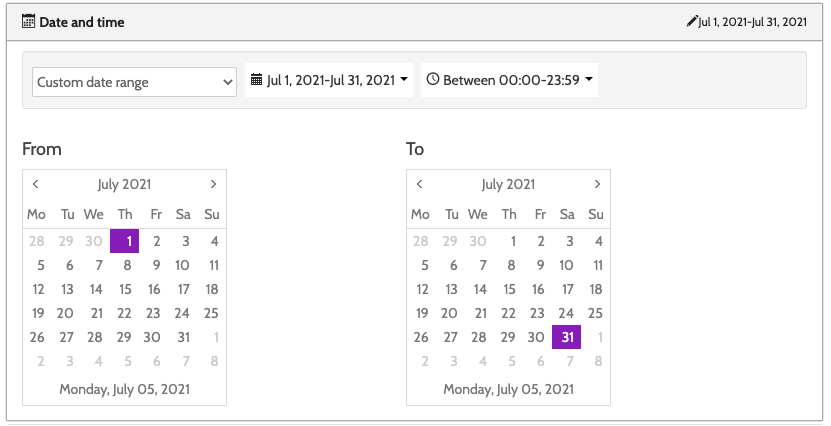
Under Date and Time, select which time period you want to gather data from for the report.
Expand the drop-down box to choose from pre-defined date ranges, or click the calendar to manually choose a custom data and time range.
Click the clock icon to manually configure the start and end time you want to gather data from for the report.
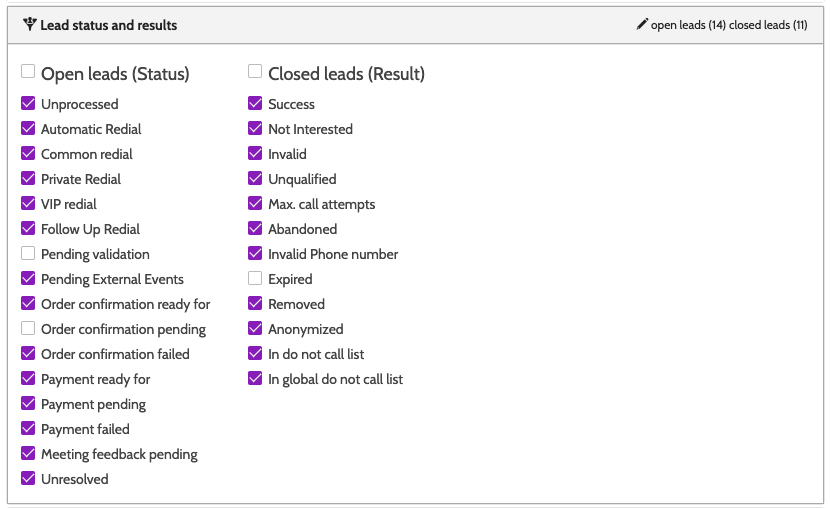
Lead Status and Results
Under Lead Status and Results, choose which data fields to include in the report.
Click Open leads (Status) and Closed leads (Result) to include all of the results listed in the report, or manually select which results to include.
Rows
Under Rows, choose which rows you want to group the report by. Click the plus icon next to an Available row to move it into Selected rows.
Change the row position by clicking the up and down arrow icons, or remove it by clicking the X icon.
Click Exclude empty rows to exclude any rows that don't have data.
We recommend selecting a maximum of 2 Rows per report, as any more may not generate properly.

Columns
Under Columns, select which KPI columns you want to display in your report.
Under Available Columns, click the plus icon next to a KPI category to expand a list of KPIs. Click the arrow icon to move the KPI to Selected columns.
Under Selected columns, change the column position by clicking the up and down arrow icons, or remove it by clicking the X icon.
Expand the Time format drop-down to choose to display the time between seconds and hours:minutes:seconds.

Viewing Report Statistics for Incoming Calls?
Please note that when creating a Report using Incoming calls KPIs, only users that belong to the top Team in the Organisational hierarchy will be able to view Incoming Report statistics.
This is because Incoming calls do not belong to an individual user, but the Organisation. Therefore only users in the top level Team of the Organisation will be able to view Incoming call statistics.
Need a Smart KPI that will filter all Incoming calls by Agent?
Reach out to Enreach support or your CX Manager today.
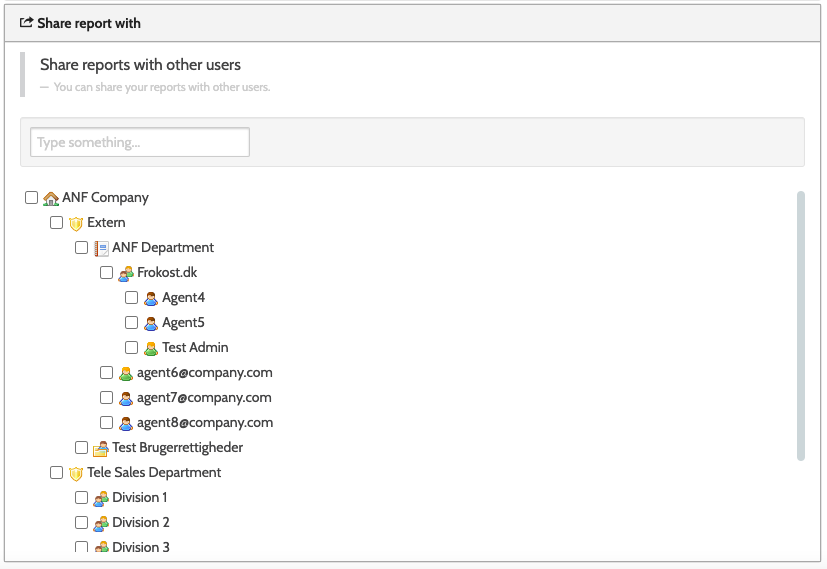
Share Report With
Under Share report with, choose which parts of your Organisation you wish to share the report with.
Click the checkbox next to the selected Organisational unit, or use the Search bar to filter the results.
When you have edited the cloned report, click Save settings to save your report.
Once it is saved, the cloned report will be displayed under Custom reports.

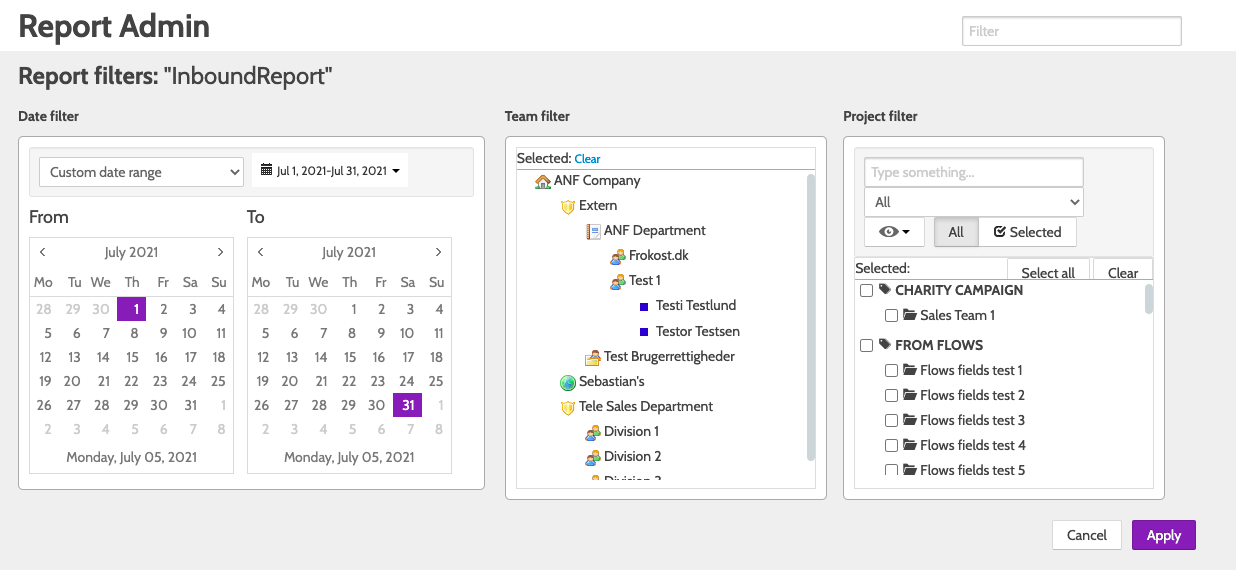
Filter Reports
To filter a report, click the funnel icon to the right of the report.
 Under Report Filters, you can adjust the date, the Team, and the Projects that are shown in the report. The methods are the same as when editing a report. Click here to head to the relevant part of the guide.
Click Apply to view the report with the updated filters, or Cancel to exit without saving.
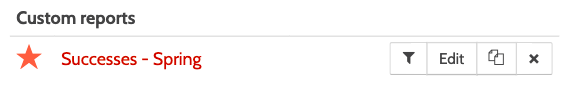
Custom Reports
Under Custom Reports you can see all Custom reports, or reports that you have cloned and edited.
Click a Custom report to move to a report list below, and click the eye icon to view the report in a separate browser window.
Click the funnel icon to filter the report, Edit to edit which data to show, the clone icon to clone and edit the report, or the cross icon to delete the report.
To create a new Report, click Create.

The options for creating a report are exactly the same for editing a report. Head to this part of the guide for more in-depth instructions on the report options.